Replace Excel Reporting with Zoho Analytics
Keep the simplicity of a spreadsheet. Add the power, speed, and intelligence of a modern analytics platform.
Sign up for freeSIGN UP FOR FREEWatch demo
- 16K
Customers
- 3M
Users
Why Move Beyond Excel for Reporting?
Get a spreadsheet-like interface that's powered by a complete analytics engine
Grid view (Spreadsheet-style reporting)
- A clean, tabular layout you already know
- Format, filter, group, and summarize data instantly
- View and scroll through large datasets without lag

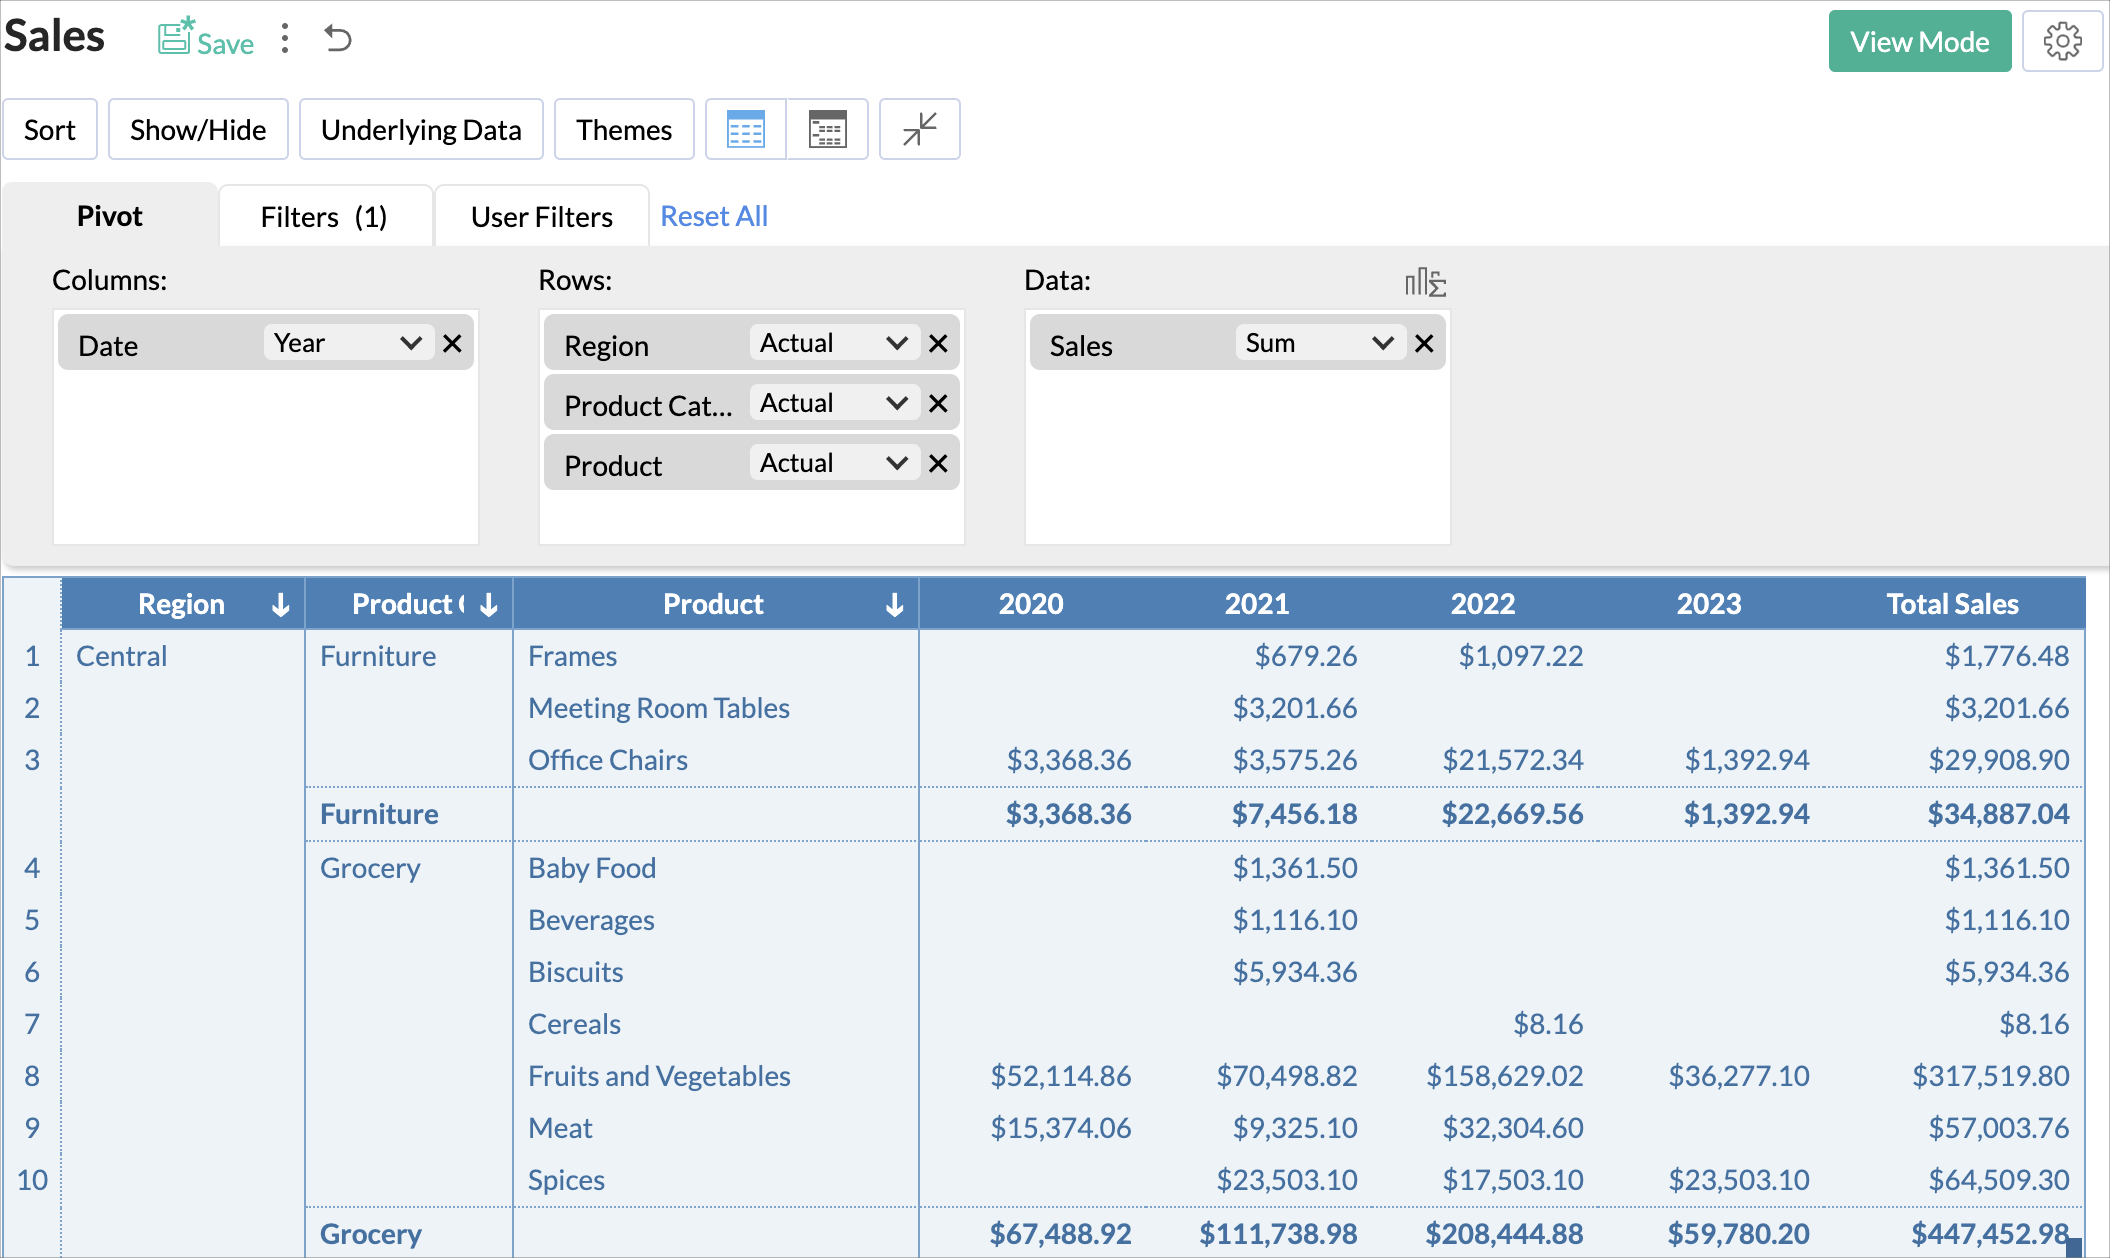
Pivot and summary reports
- Rearrange data dynamically
- Compare performance across regions, dates, teams, or categories
- Automatically calculate totals, averages, growth, variance, and more
Charts and dashboards
- Turn your spreadsheet rows into visual stories
- Mix KPIs, charts, tables, and performance indicators
- Build interactive dashboards your teams will actually use

The limits of traditional spreadsheets
Traditional spreadsheets are familiar and widely used, but as your organization and data scale, they start to show their limitations:
Multiple file versions shared across emails and teams
Hard to combine data from different sources
High risk of manual errors and overwritten cells
Reports become outdated the moment they're shared
Little room for deeper analysis and no drill-down visibility
Slow performance when dealing with larger datasets
It's time for an advanced Excel alternative for reporting that's faster, more flexible, more reliable, and built for growth - better than the Excel reporting experience you love.
What Zoho Analytics Can Do That Excel Can’t
Excel is powerful for calculations and individual analysis. But it wasn’t built for modern, scalable reporting. Zoho Analytics fills that gap by transforming spreadsheets into a connected, intelligent, and automated analytics system for growing teams.

Advanced Data Preparation Without Complex Formulas
Managing data in Excel often means maintaining long formulas and repetitive cleanup. Zoho Analytics simplifies this with a visual, no-code data preparation layer.
- Clean, transform, enrich, and model your data using guided workflows
- Automatically handle missing values, duplicates, and inconsistent formats
- Create calculated fields and metrics without writing long formulas
- Combine Excel data with data from databases, cloud apps, and business systems in one model
Your spreadsheet becomes a reliable and structured dataset for deeper analysis.
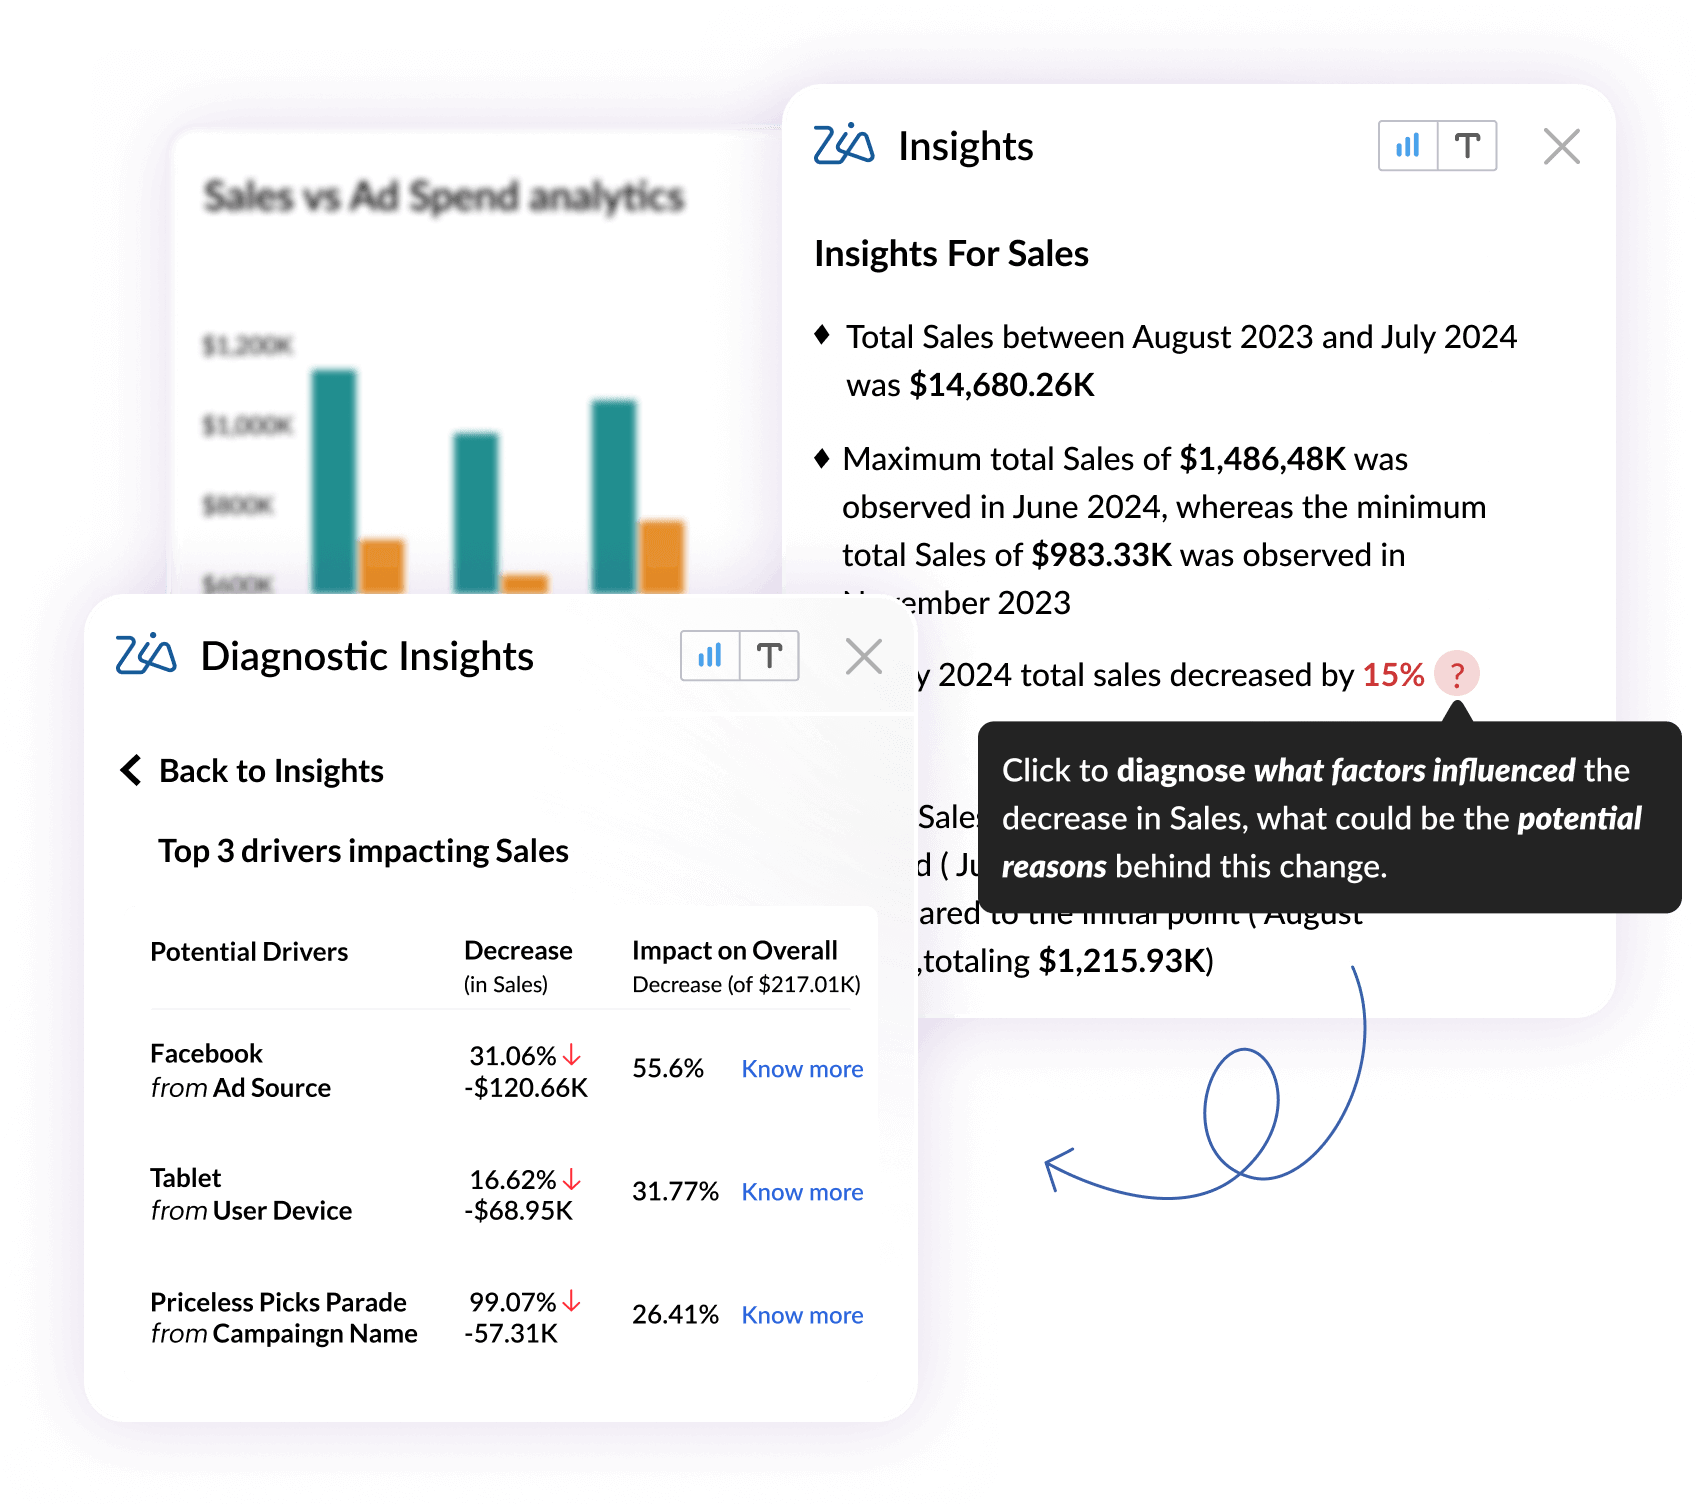
Intelligent Insights Powered by AI
Excel shows you numbers. Zoho Analytics helps you understand what they mean.
- Ask questions in plain English and get instant answers using AI
- Automatically identify trends, patterns, outliers, and key drivers
- Get AI-generated summaries of performance changes in simple language
- Receive proactive alerts when metrics spike, drop, or behave unusually
This turns reporting into continuous insights discovery instead of manual analysis

Automated Reporting That Stays Up to Date
With Excel, reports are outdated the moment they’re shared. Zoho Analytics keeps them live and trusted.
- Automatically refresh data from Excel files and connected sources
- Schedule dashboards and reports to be delivered daily, weekly, or monthls
- Set alerts when KPIs cross defined thresholds
- Eliminate manual exports, follow-ups, and version confusion
Everyone works with the same, most recent data, without chasing files
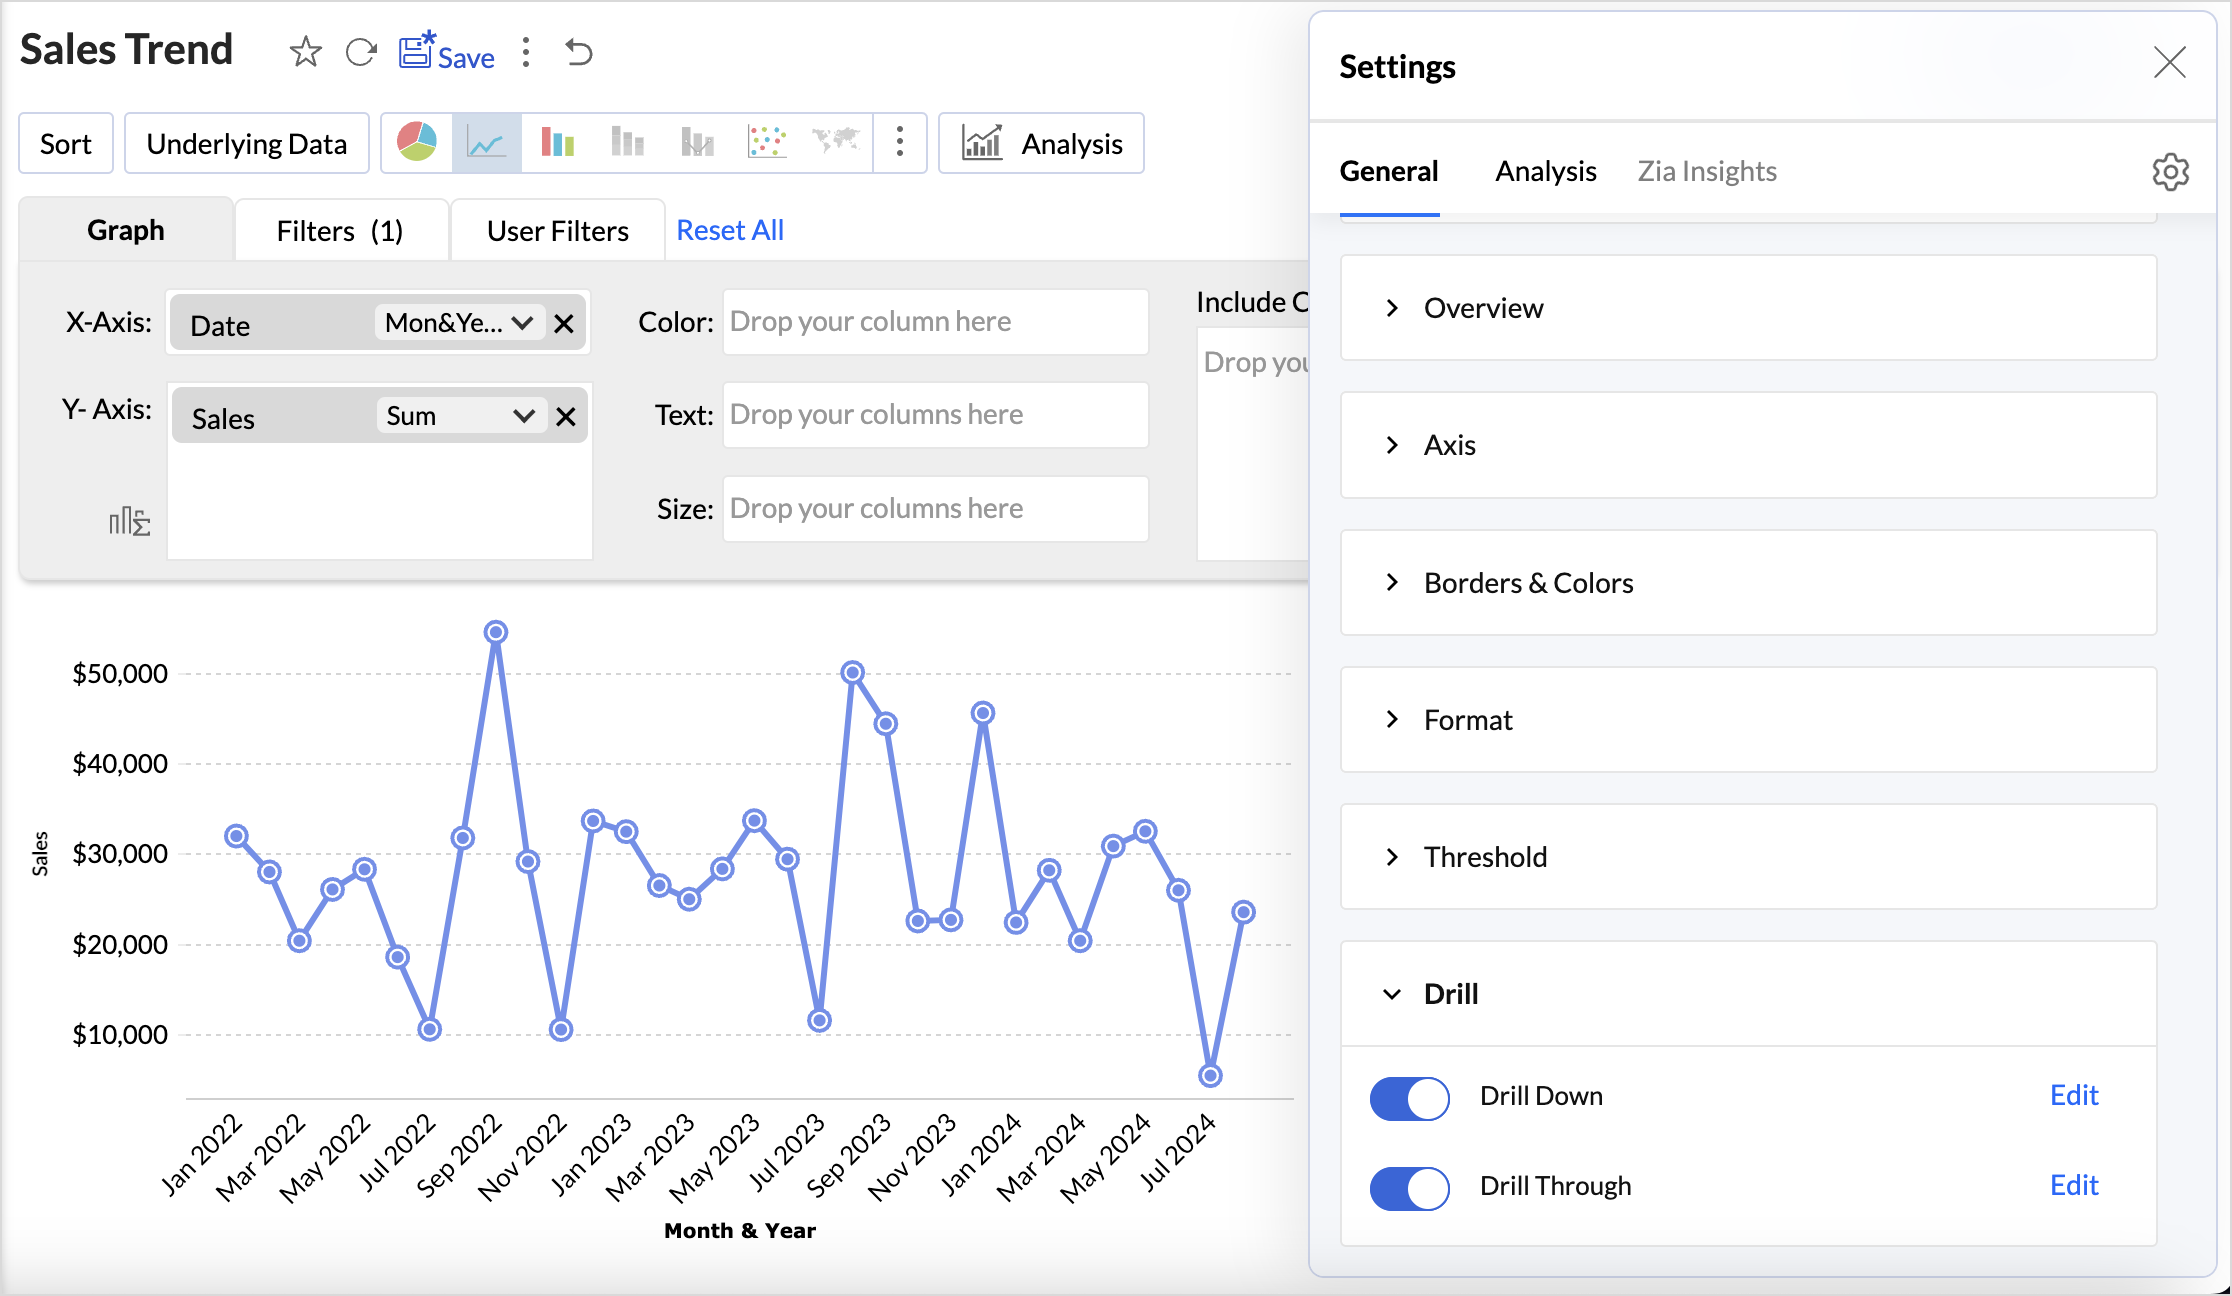
Interactive Dashboards with Drill-Down Analysis
Excel limits how easily users can explore data without creating new sheets or formulas. Zoho Analytics is built for exploration.
- Drill down from summary metrics to row-level details in seconds
- Filter, slice, and pivot reports dynamically without breaking anything
- Combine KPIs, charts, tables, and filters into interactive dashboards
- Enable self-service analysis for business users across teams
Insights are easier to explore and faster to act on.

Built-In Collaboration and Governance
Spreadsheets are file-based. Zoho Analytics is platform driven.
- Share reports and dashboard securely through role-based access and permissions
- Collaborate using comments, annotations, and share dashboards directly on reports
- Track changes with audit logs and governance as usage scales
- Embed analytics into internal tools or customer-facing applications
This ensures consistency, security, and control across the organisation.
Excel vs Zoho Analytics: A quick comparison
| Features | Zoho Analytics | Excel |
|---|---|---|
| Data handling | Optimized for millions of rows | Slows with large files |
| Data integration | 500+ native data connectors with auto-sync | Manual imports |
| Data preparation | In-built data preparation tool for cleaning and transformation | Requires heavy formula |
| Data blending | Automatic data blending | Complex and manual |
| Data visualization | 50+ interactive visualizations | Basic charts |
| Drill-down | Deep drill-down and drill-through | Limited |
| AI insights | AI-generated insights and summaries | Not available |
| Natural language query | Ask questions in plain English | No |
| Forecasting | Built-in predictive models | Basic |
| Collaborative work | Real-time sharing and commenting | Emailing reports and files |
| Automation | Automated refresh, alerts, and delivery | Macros needed |
| KPI tracking | Prebuilt KPI widgets and monitors | Manual setup |
| Data governance | Role-based access, audit logs | Hard to control |
| Security | Enterprise-grade security | File-level |
| Scalability | Scales with teams and data | Not built for growth |
| Extensibility | APIs, developer tools, white-labelling. | Scripts and plugins |

Migrate Your Excel Sheets in Minutes (No-code)
Already using Excel? You don't have to start over.
Zoho Analytics lets you bring in your existing spreadsheets into a modern analytics environment and transition to automated, scalable reporting, without disturbing current workflows.
Import your Excel files exactly as they are
Create interactive dashboards on top spreadsheet data
Keep data updated with scheduled or automatic refresh
Shift from manual Excel reporting to modern analytics at your own pace
A smooth, risk-free way to move beyond spreadsheet and scale your reporting.
Frequently asked questions
Why choose Zoho Analytics instead of Excel for reporting?
- Zoho Analytics is an advanced Excel alternative for reporting that removes manual work. It enables dashboard automation, real-time data updates, and interactive dashboards, making it a smarter, more reliable option than Excel for ongoing business reporting.
Can I import my Excel files directly into Zoho Analytics?
- Yes. Zoho Analytics works as an Excel to BI migration tool, letting you import data from Excel files and instantly convert them into automated, dynamic, and shareable BI reports and dashboards.
What is the ROI of replacing Excel reporting with Zoho Analytics?
- When teams replace Excel reporting, they save hours spent on manual updates, avoid data errors, and gain faster insights. Automated dashboards and faster insights lead to higher productivity and quicker decision-making.
Is Zoho Analytics suitable for non-technical users migrating from spreadsheets?
- Yes. Zoho Analytics is an advanced Excel alternative for reporting built for business users, offering drag-and-drop tools and automation that are better than Excel for reporting without needing any technical or BI expertise.